Community Watershed Monitoring
What is the Community Watershed Monitoring Network?
It's a partnership between the RDN's Drinking Water and Watershed Protection (DWWP) program, the Ministry of Environment and Climate Change Strategy (ENV), Island Timberlands LP (managed by Mosaic Forest Management), and many amazing community watershed stewardship groups in our region.
The RDN provides the equipment and works with ENV to complete annual training and data analysis. ENV contributes expertise in water quality testing, deciphering gathered data and guidance in program direction. Mosaic Forest Management sponsors the lab analysis costs for Quality Assurance and Quality Control, loans volunteers' safety gear, and provides access to the upper watersheds. Dedicated community groups donate their time, attending annual training sessions, calibrating equipment and getting out on their local streams to collect and monitor water quality data.
Resources
Why monitor watersheds?
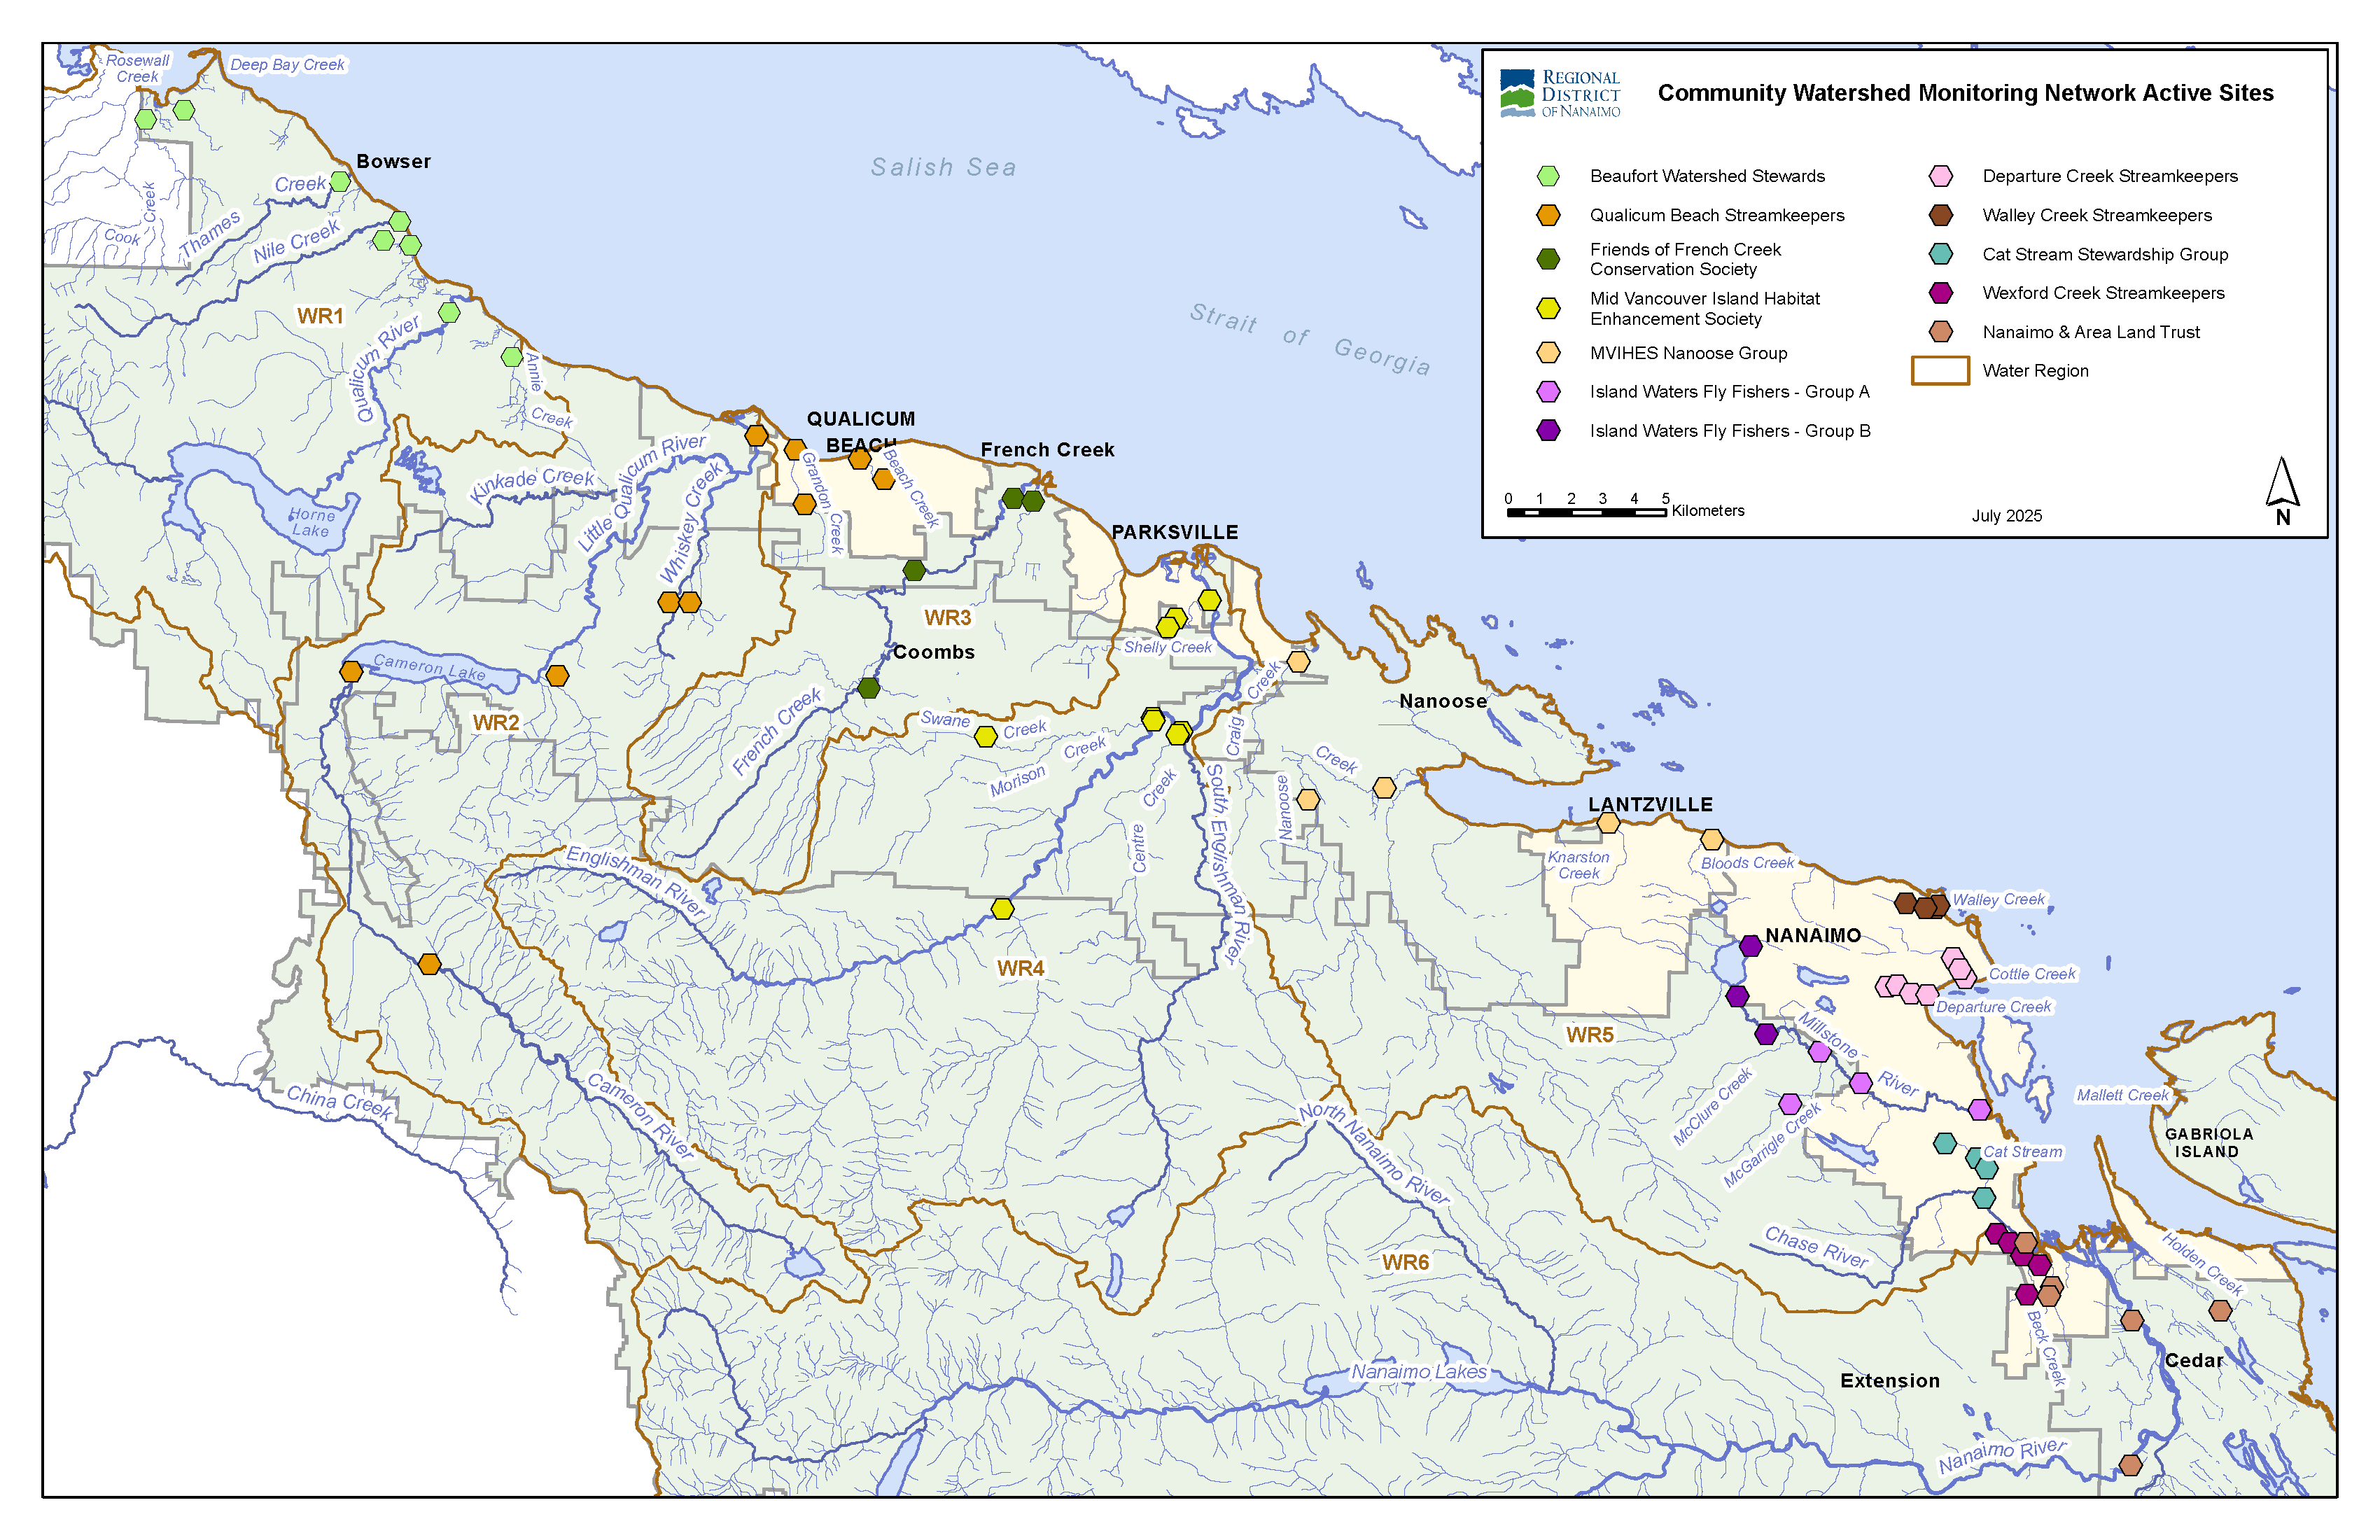
To expand on the provincial database, collect enough data to see watershed trends and raise watershed health awareness in local communities. The long term objective is to use multiple years of data to determine which watersheds require more detailed monitoring and/or improved watershed management and to assist in land use planning. Data is collected for turbidity, dissolved oxygen, temperature and conductivity for 67 sites in 26 watersheds across our Region.
Additional lab analysis has and continues to be completed to further investigate what potential contaminants are associated with water quality exceedances observed in the data collection. In 2014 eleven sites in northern RDN waterways were sampled for E.coli and Phosphorus, in 2015 eleven sites in southern RDN waterways were sampled for E.coli, Phosphorous and metals, and in 2019 with nine sites sampled for Chloride (as a proxy for road run-off) and twelve sites sampled for Phosphorus (as a proxy for agricultural run-off). Further sampling for nutrients was completed in 2021 in-partnership with ENV in areas with upstream agricultural land-use.
When does watershed monitoring take place?
Monitoring occurs once a week for 5 weeks in the summer low flow period (August - September) and once a week for 5 weeks in the fall flush period (October - November).
Who is responsible for watershed monitoring?
The 15 environmental stewardship organizations and Streamkeepers currently and previously involved are:
| Stewardship Organizations | Maps |
|---|---|
|
|
|
|
|
|
|
|
|
Where does watershed monitoring happen?
There are 45 streams currently monitored by trained volunteers, these include:
- Chef Creek
- Sandy Creek
- Rosewall Creek
- Cook Creek
- Deep Bay Creek
- Nash Creek
- Thames Creek
- Nile Creek
- Big Qualicum River
- Hunts Creek
- Annie Creek
- Upper Cameron River
- Cameron River
- Little Qualicum River
- Whiskey Creek
- Harris Creek
- Grandon Creek
- Beach Creek
- French Creek
- Morningstar Creek
- Morison Creek
- Swayne Creek
- Shelly Creek
- Upper Englishman River
- Englishman River
- Centre Creek
- South Englishman River
- Craig Creek
- Nanoose Creek
- Knarston Creek
- Bloods Creek
- Walley Creek
- Upper Millstone Creek
- Millstone River
- McGarrigle Creek
- Departure Creek
- Cottle Creek
- Chase River
- Beck Creek
- Richards Creek
- Cat Stream
- Holden Creek
- Nanaimo River
- Mallett Creek
- Wexford Creek
After three years of sampling, each site's results are reviewed and testing at sites with consistently good water quality may be suspended for three to five years. This allows resources to be used to expand the network, adding sampling at new sites where needed.

Reports
2023 Report - CWMN Data Analysis Technical Memorandum
2021 Report - Community Watershed Monitoring Network Data Analysis (2011 - 2020)
2018 Report - Surface Water Quality Trend Analysis for RDN CWMN Data (2011 - 2017)
2015 Lab Analysis Report - IWFF DCS VIU
2012 -2015 Water Quality Trend Report - Nanoose Streamkeepers
2012-2014 Water Quality Trend Report
Presentations
2024 Results Session - Data Summary and Strategic Planning Presentation
2024 Results Session Guest Presenter - BC Province Benthic Invertebrate Analysis
2024 Results Session Guest Presenter - BC Province Stormwater
2024 Results Session Guest Presenter - BCCF Mitigating Impacts of Tire Wear Toxins
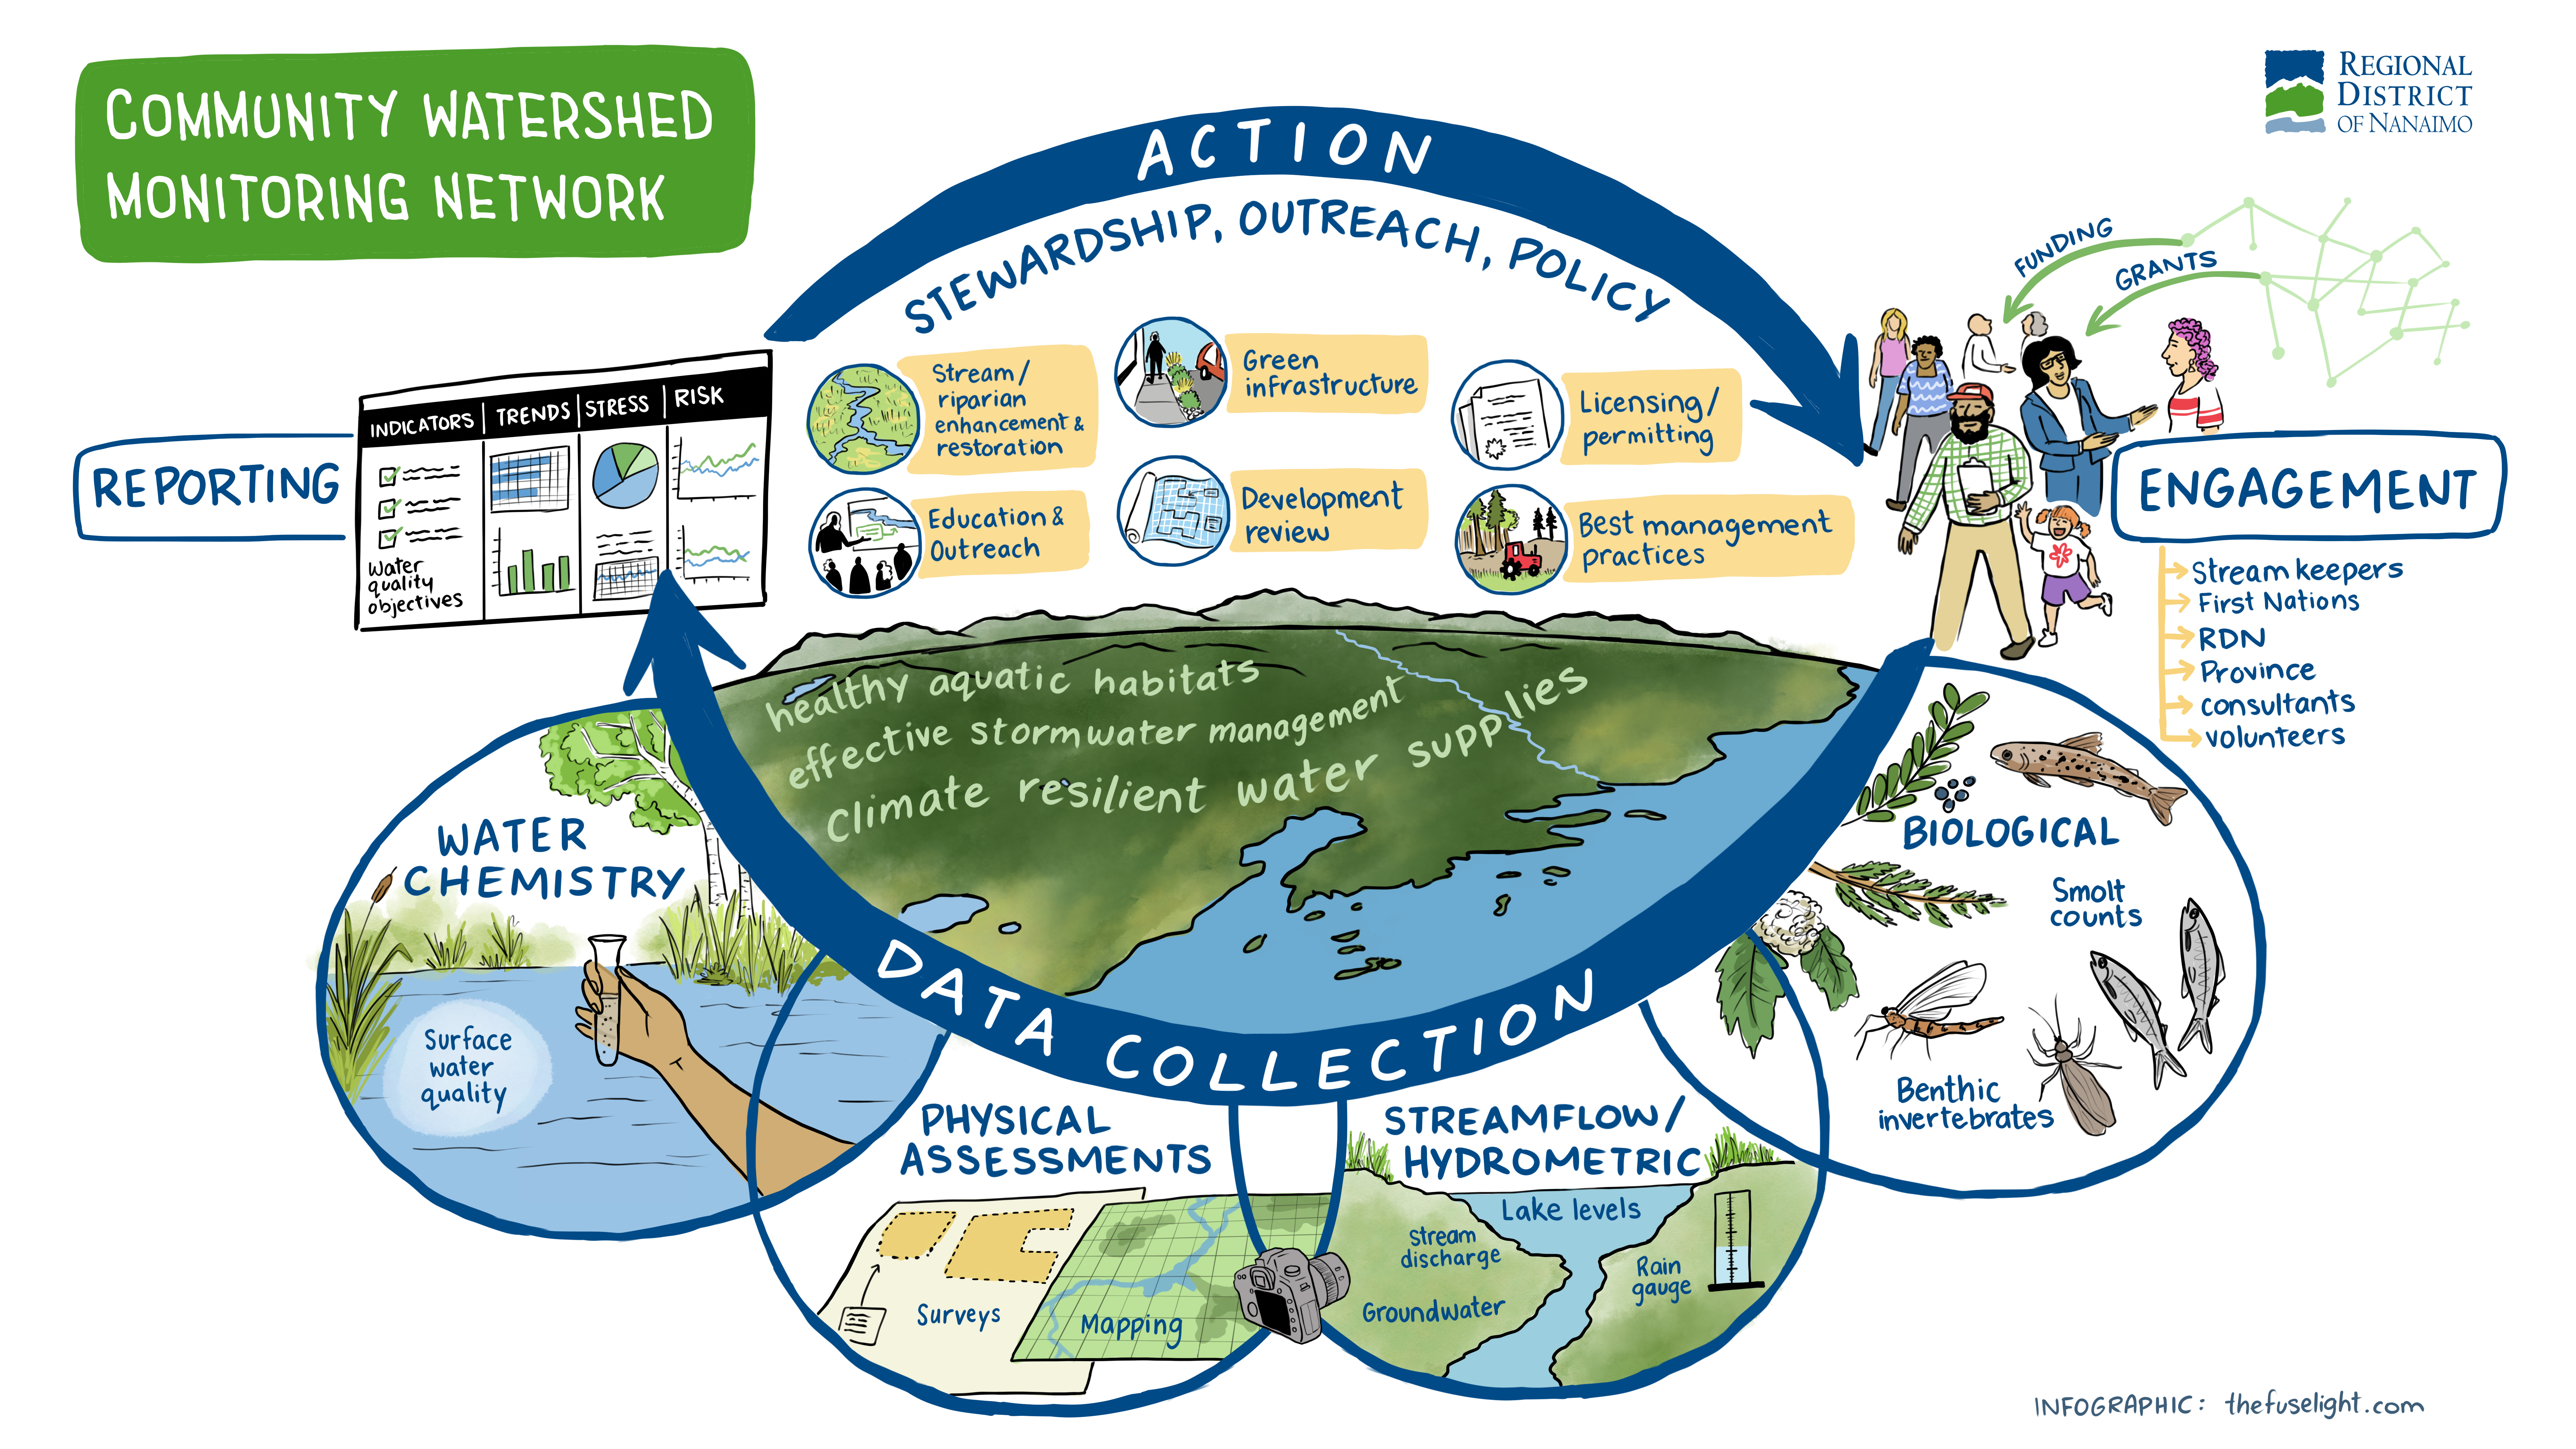
2023 Results Session Data to Action Dialogue - Graphic Artist Event Recording
2023 Results Session Guest Presenter - Ministry of Forests Hydrometric Monitoring
2023 Results Session Guest Presenter - BCCF Hydrometric Community Flo-Mo Network
2023 Results Session Guest Presenter - Weaver Technical Stream Mapping
2023 Data Collection to Action Infographic
2022 Data Summary - Results Session RDN Presentation Slides
2021 Data Summary - Results Session Recorded Presentation
2021 Data Summary - Results Session Presentation Slides
2020 Data Summary - Results Session Recorded Presentation
2020 Data Summary - Results Session Questions & Answers
2020 Data Summary - PowerPoint Presentation
2019 Data Summary - Results Session Recorded Presentation
2019 Data Summary - Powerpoint Presentation
2018 Data Summary - Powerpoint Presentation
2017 Data Summary - Powerpoint Presentation
Results by Water Region
Water Region 1 Big Qualicum
Water Region 2 Little Qualicum
Water Region 3 French Creek
Water Region 4 Englishman River
Water Region 5 Nanoose to South Wellington
WR 5-1 Nanoose to Nanaimo
WR 5-2 Nanaimo to South Wellington
Water Region 6 Nanaimo River
Water Region 7 Gabriola, Mudge, and DeCourcy Islands
Resources
Provincial
British Columbia Approved Source Drinking Water Quality Guidelines Summary
ENV Ambient Water Quality Guidelines
ENV Water Quality Objectives West Coast Region
ENV Water Stewardship Division
RDN
Our Watersheds Interactive Map
Stewardship Seed Funding Support
Tool Lending Library Application Form
Tool Lending Library Equipment
Watershed Stewardship Network - Get Involved
Videos
Community Watershed Monitoring Network program information (2020)
How to take a sample following provincial protocols (Temperature, DO, SpC, Turbidity)
How to complete monitoring equipment calibrations (YSI ProQuatro and LaMotte turbidimeter)
