Nanoose (Area E) Water Monitoring
Purpose
The RDN and residents of Nanoose value sustainable water supply within the area. To better understand water in Area E, the RDN is working to collect more data and better information on local groundwater and surface water. Long-term monitoring of wells and streams will enable trends to be observed and management practices to be based on the state of the water resource. Modelling the dynamics of water sources in the area will help decision-makers be well informed when planning for the future.
Water Budget Model
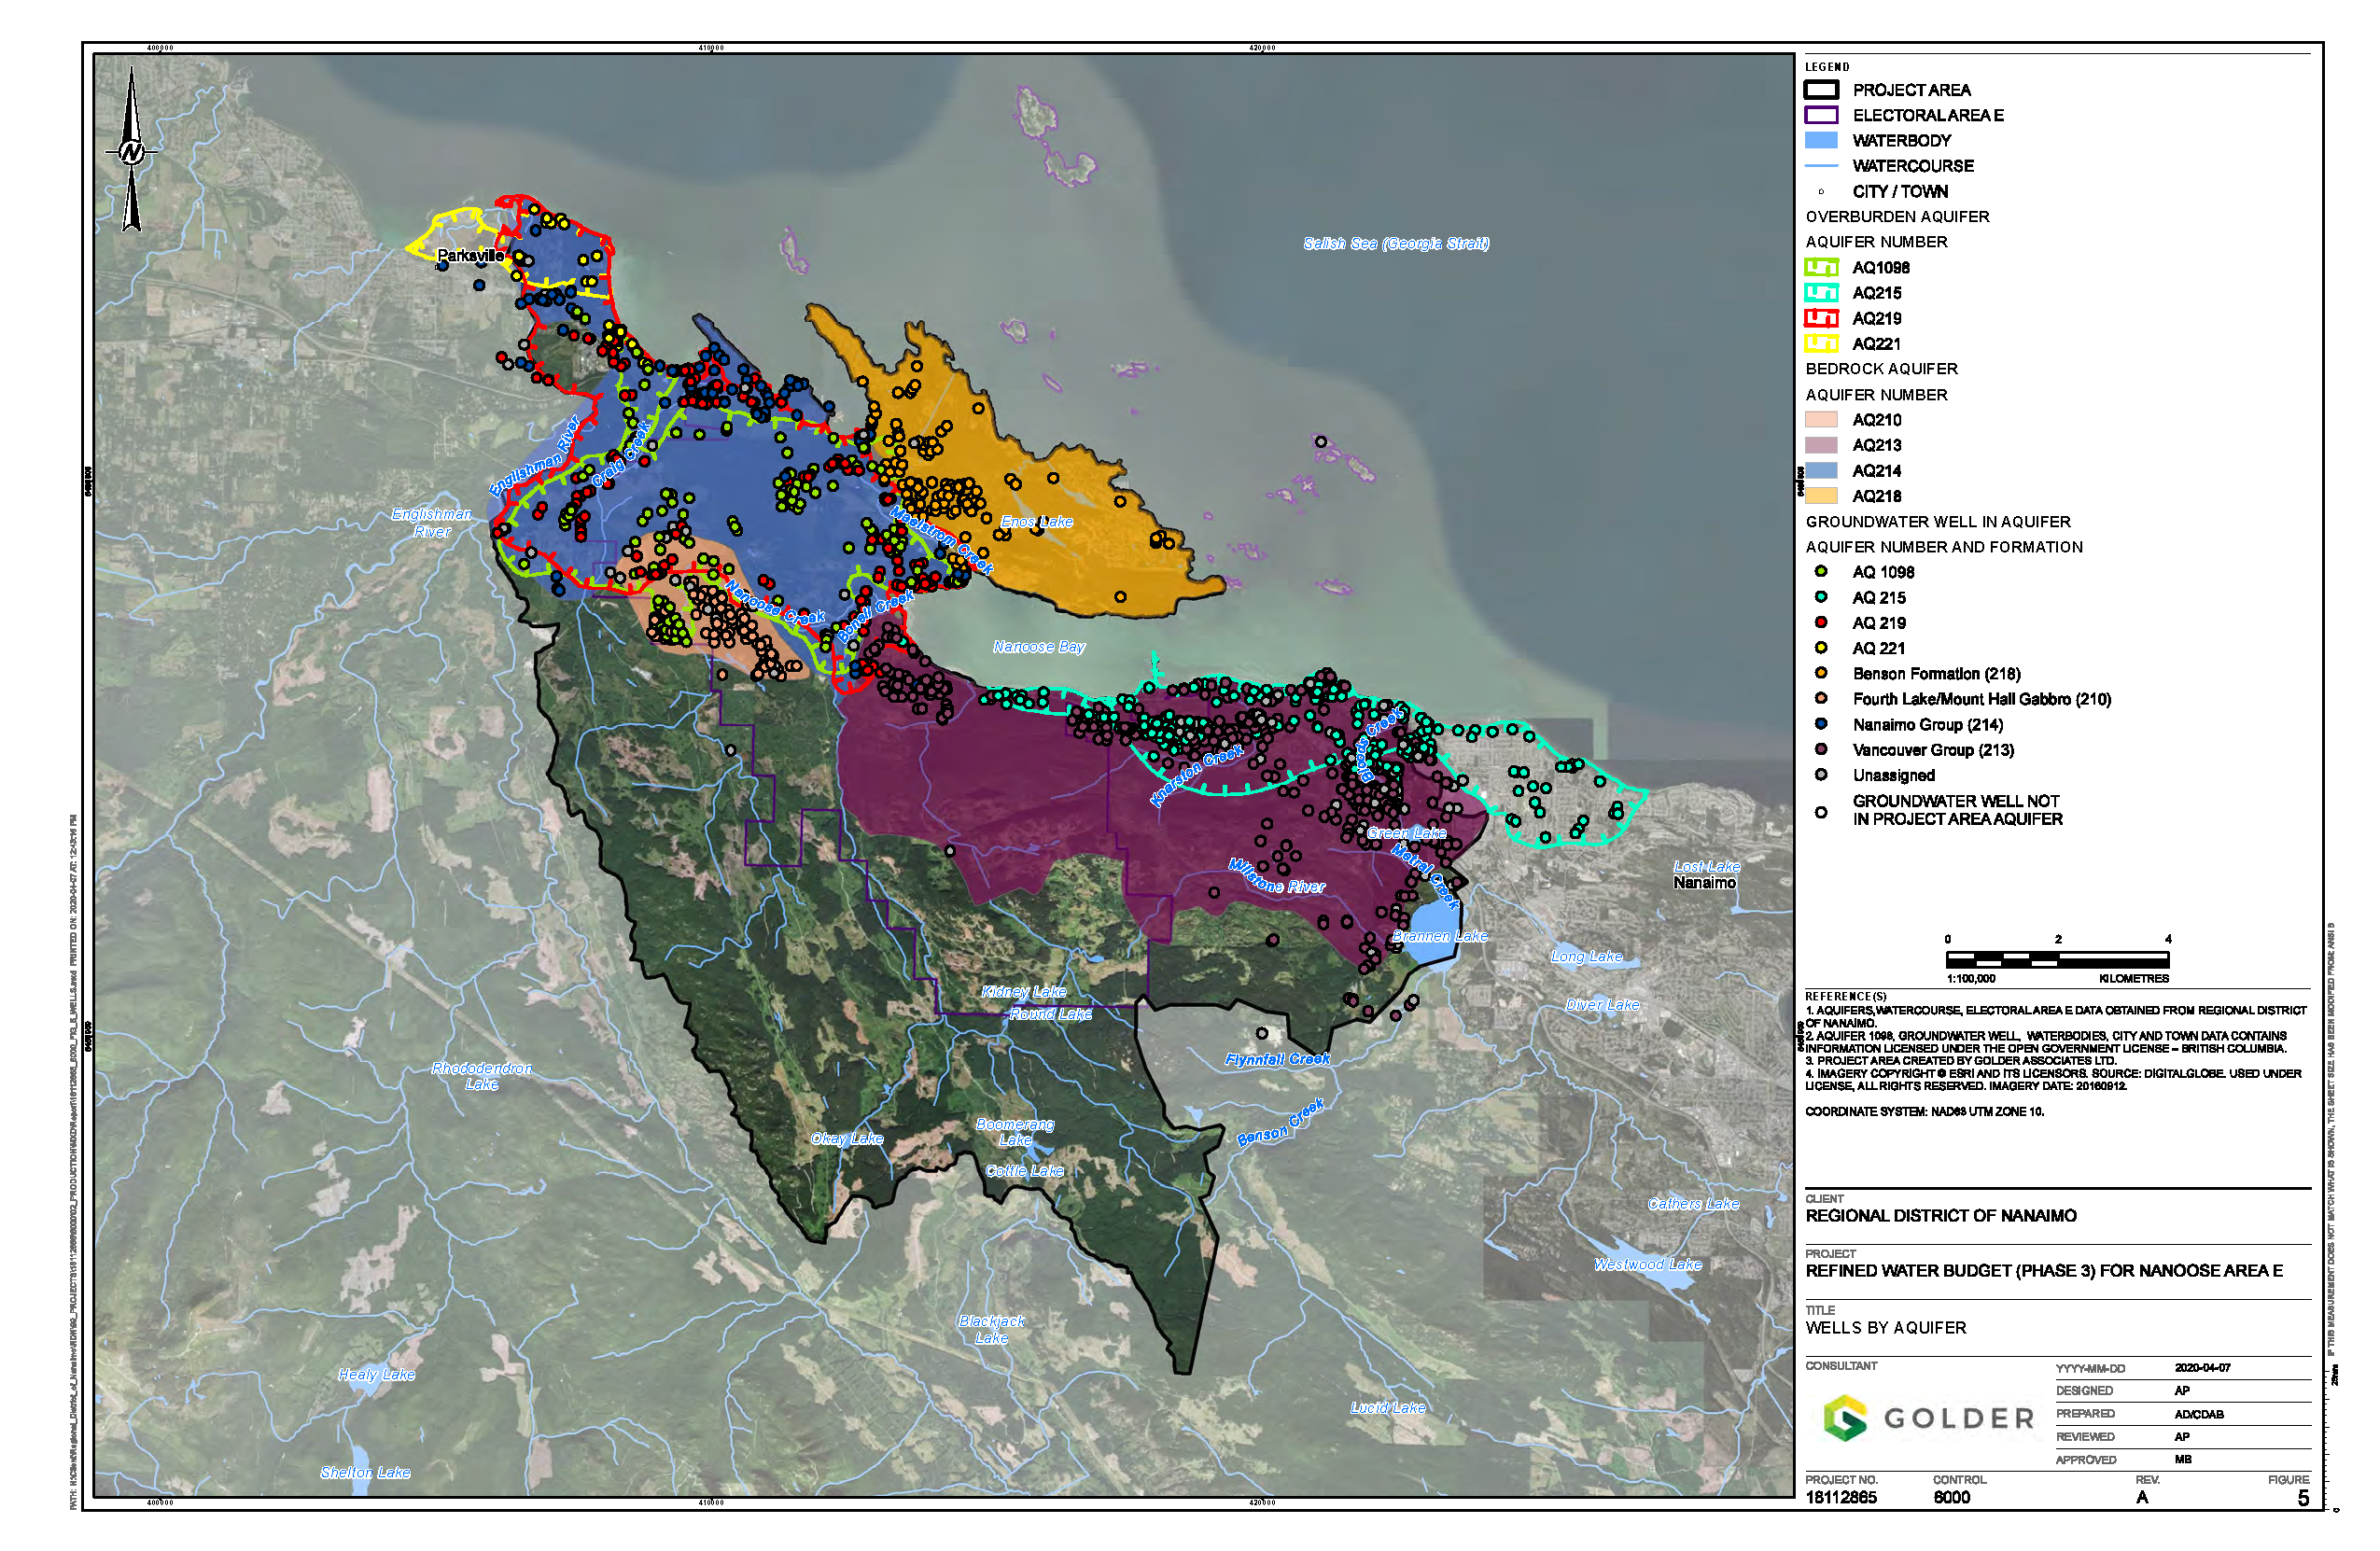
In 2020, a numerical Water Budget model was completed for the Nanoose area. All the available monitoring data on groundwater and surface water, as well as topography, climate, water demand, and land use data was input to model water supply and demand under various scenarios. This included how groundwater levels and streamflows would be affected by (1) median climate change scenario, (2) water demand scenarios (full build-out), and (3) land cover change scenarios (impervious coverage). The results indicated that the most significant impacts to be seen will be from changing climate, with water level declines of up to 3m in overburden (sand and gravel) aquifers and up to 9m in bedrock aquifers within the study area. Baseflow in creeks is modelled to decline by approximately 40 percent in Craig Creek and 30 percent in Nanoose Creek and Bonnell Creek during the summer months. These impacts would be further compounded with an increase in impervious coverage, with declines greater than the sums of the individual predictions in scenario (1) and (3). The full report is available in the reports section on this page.
This “Phase 3” numerical model built off the conceptual model developed in the preliminary Phase 1 Water Budget Study for the Regional District of Nanaimo as a whole completed in 2013. This Nanoose-specific monitoring program is a follow-up to the regional water budget study, focusing on this priority sub-region.
Monitoring
Between 2015 and 2017, the RDN expanded water monitoring efforts within the geographical area, in order to develop a higher-resolution understanding of groundwater and surface water characteristics in Nanoose. Ultimately this information will be used to support sustainable development decisions and protect water resources over the long term.
Monitoring of volunteered private wells in the Parker Rd area, near to the RDN owned well, began April 1, 2015. The objective of this monitoring is to understand long-term capacity of the aquifer and determine sustainable operating parameters for the RDN well, so that the wells in the surrounding area are not significantly impacted when the RDN well is operated. The RDN well at Parker Rd is not currently is use and is on standby for a future time when it may or may not be needed.
In 2016 a water monitoring plan for Area E as a whole was developed; find it here in the Phase 2 Water Budget report. In the summer of 2017, 5 new volunteer observation wells were added within the area, to fill spatial gaps in groundwater level data. A streamflow monitoring station has also been added on Nanoose Creek as of February 2017.
Water levels are tracked with a data logger in each well, to understand impacts of pumping, seasonal changes to do with climate and long-term trends with both. Electrical conductivity is monitored in some of the coastal wells to gauge if there is concern with saltwater intrusion occurring.
There are 11 volunteer monitoring wells in Area E that the RDN continues to download data from every 3-4 months.
Data Graphs
(UPDATED AUGUST 19, 2019) The following graphs are for the wells monitored in the Parker Road area as a part of this program. Individual well owners know the unique identifier for their well so they may look-up their results. 'B' stands for bedrock and 'O' stands for overburden. The data displayed in the graphs shows groundwater elevation (water level), rainfall (from the Fairwinds Golf Course rain gauge), and electrical conductivity (EC) for coastal wells. Data has been collected since April 2015 and these graphs are now current to September 2018 . Note that well B8 withdrew from the program in October 2015 and B6 withdrew in January 2018. Groundwater Level Graphs - All Wells - Current to Sept 2018 (downloadable PDF)
Important Notes:
Water levels in the bedrock wells, particularly in the summer months, are influenced by the cumulative effect of all bedrock wells pumping in the vicinity.
Water levels in the overburden (sand and gravel) wells do not appear to react to pumping in the bedrock aquifer.
Reports
Notes from past meetings
Presentations from hydrogeologists or staff
- February 2015 Presentation from GW Solutions
- July 2015 Presentation GW Solutions
- July 2015 Presentation from Provincial Groundwater Protection Officer (MFLNRO)
- September 2015 Presentation from GW Solutions
- March 2018 Presentation from Staff
- August 2019 Presentation from Staff