Population Statistics
Statistics Canada produces statistics that help Canadians better understand their country—its population, resources, economy, society and culture. On February 9, 2022 Statistics Canada released the 2021 Population Statistics.
The 2021 Census population for the Regional District of Nanaimo is 170,367. Of this number, 26 per cent (43,745) live in electoral areas and First Nation communities and the remaining 74 per cent (126,625) live in municipalities. Click on the Populations Statistics tab below to see a full breakdown of the population within the Regional District of Nanaimo.
Population Statistics
| Area | Population | ||||||||
|---|---|---|---|---|---|---|---|---|---|
| Electoral Area | 2001 | 2006 | 2011 | 2016 | 2021 | 2001-2006 % change |
2006-2011 % change |
2011-2016 % change |
2016-2021 % change |
| A | 6,423 | 6,751 | 6,908 | 7,058 | 7,481 | 5.1% | 2.3% | 2.2% | 6.0% |
| B | 3,522 | 4,050 | 4,045 | 4,033 | 4,500 | 15.0% | -0.1% | -0.3% | 11.6% |
| C a | 1,932 | 2,508 | 2,834 | 2,808 | 3,344 | 29.8% | 13.0% | -0.9% | 19.1% |
| E | 4,820 | 5,462 | 5,674 | 6,125 | 6,765 | 13.3% | 3.9% | 7.9% | 10.4% |
| F | 5,546 | 6,680 | 7,422 | 7,724 | 8,216 | 20.4% | 11.1% | 4.1% | 6.4% |
| G b | 6,113 | 7,023 | 7,158 | 7,465 | 8,109 | 14.9% | 1.9% | 4.3% | 8.6% |
| H | 3,108 | 3,474 | 3,509 | 3,884 | 4,291 | 11.8% | 1.0% | 10.7% | 10.5% |
| Electoral Area Total | 31,464 | 35,948 | 37,550 | 39,097 | 42,709 | 14.3% | 4.5% | 4.1% | 9.2% |
| Area | Population | ||||||||
|---|---|---|---|---|---|---|---|---|---|
| Municipalities | 2001 | 2006 | 2011 | 2016 | 2021 | 2001-2006 % change |
2006-2011 % change |
2011-2016 % change |
2016-2021 % change |
| Nanaimo | 73,000 | 78,692 | 83,810 | 90,504 | 99,863 | 7.8% | 6.5% | 8.0% | 10.3% |
| Parksville | 10,323 | 10,993 | 11,977 | 12,514 | 13,642 | 6.5% | 9.0% | 4.5% | 9.0% |
| Lantzville a | 3,653 | 3,661 | 3,601 | 3,605 | 3,817 | 0.2% | -1.6% | 0.1% | 5.9% |
| Qualicum Beach b | 7,849 | 8,502 | 8,687 | 8,943 | 9,303 | 8.3% | 2.2% | 2.9% | 4.0% |
| Municipalities Total | 94,825 | 101,848 | 108,075 | 115,566 | 126,625 | 7.4% | 6.1% | 6.9% | 9.6% |
| Area | Population | ||||||||
|---|---|---|---|---|---|---|---|---|---|
| First Nation Reserves | 2001 | 2006 | 2011 | 2016 | 2021 | 2001-2006 % change |
2006-2011 % change |
2011-2016 % change |
2016-2021 % change |
| Snuyneymuxw 1 | 238 | 279 | 377 | 360 | 386 | 17.2% | 35.1% | -4.5% | 7.2% |
| Snuyneymuxw 2 | 20 | 21 | 26 | 20 | 37 | 5.0% | 23.8% | -23.1% | 85.0% |
| Snuyneymuxw 3 | 33 | 50 | 81 | 92 | 67 | 51.5% | 62.0% | 13.6% | -27.2% |
| Snuyneymuxw 4 | 158 | 208 | 180 | 259 | 219 | 31.6% | -13.5% | 43.9% | -15.4% |
| Nanoose | 207 | 191 | 204 | 230 | 245 | -7.7% | 6.8% | 12.7% | 6.5% |
| Qualicum | 71 | 86 | 81 | 74 | 82 | 21.1% | -5.8% | -8.6% | 10.8% |
| First Nations Total | 727 | 835 | 949 | 1,035 | 1,036 | 14.9% | 13.7% | 9.1% | 0.1% |
| Area | |||||||||
|---|---|---|---|---|---|---|---|---|---|
| RDN | 2001 | 2006 | 2011 | 2016 | 2021 | 2001-2006 % change |
2006-2011 % change |
2011-2016 % change |
2016-2021 % change |
| Total Population c | 127,016 | 138,631 | 146,574 | 155,698 | 170,367 | 9.1% | 5.7% | 6.2% | 9.4% |
Source: Statistics Canada, www.statcan.gc.ca (2001, 2006, 2011, 2016 and 2021 Canadian Census)
The 2001 population is adjusted to reflect that Area D was incorporated into Area C and Lantzville. The 2001 population is adjusted to take into account boundary changes between the 2001 and 2006 CensusesPopulation Growth Chart
Census Profiles
Electoral Areas:
- Electoral Area A
- Electoral Area B
- Electoral Area C
- Electoral Area E
- Electoral Area F
- Electoral Area G
- Electoral Area H
Municipalities:
First Nation Reserves:
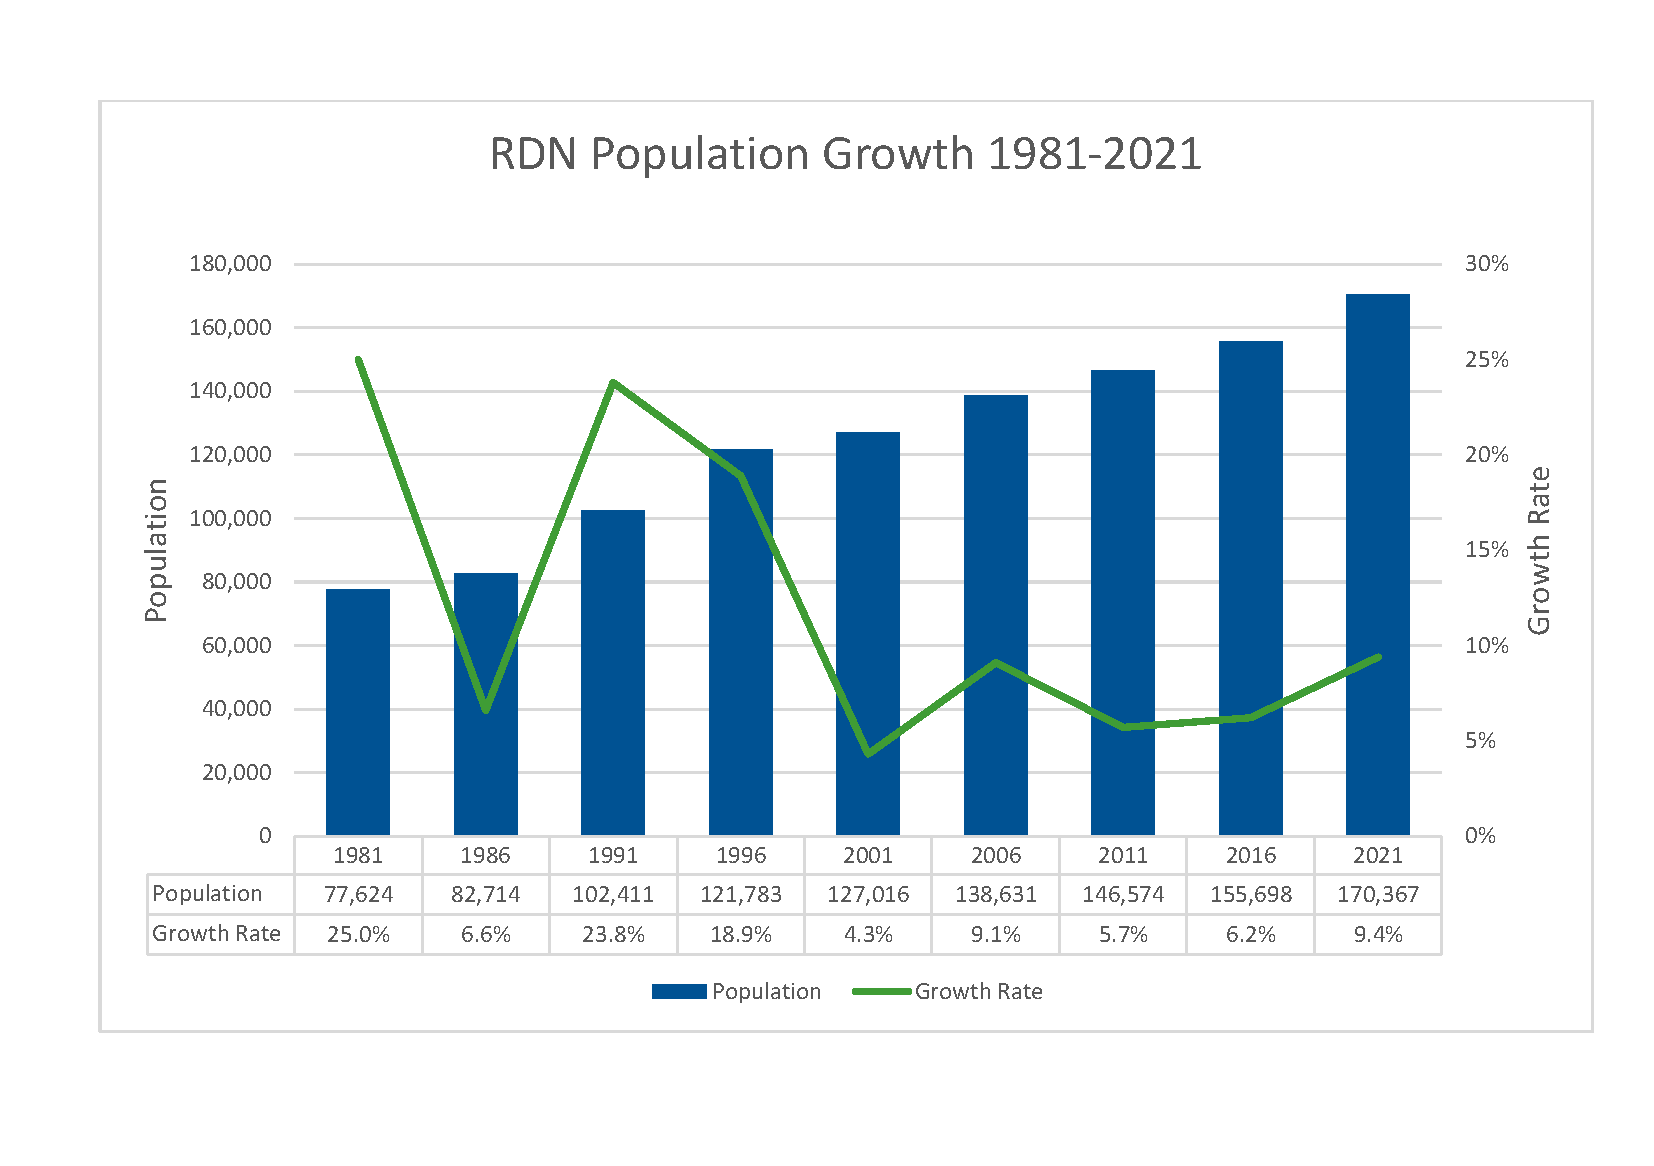
Population Growth 1981-2021
The population of the region increased from 77,624 residents in 1981 to 170,367 residents in 2021. This means an increase of 119% during that time at a growth rate of approximately 3 per cent per year, on average.
Population growth rates in the Regional District have fluctuated over the past 40 years during different census periods. These highs and lows are the result of a range of factors including migration, aging as well as births and deaths.
| Census Year | Estimated Population | Census Period | Census Period Growth Rate (%) | Average Annual Growth Rate (%) |
| 1981 | 77,624 | 1976-1981 | 25 | 5 |
| 1986 | 82,714 | 1981-1986 | 7 | 1.4 |
| 1991 | 102,411 | 1986-1991 | 24 | 4.8 |
| 1996 | 121,783 | 1991-1996 | 19 | 3.8 |
| 2001 | 127,016 | 1996-2001 | 4 | 0.8 |
| 2006 | 138,631 | 2001-2006 | 9 | 1.8 |
| 2011 | 146,574 | 2006-2011 | 6 | 1.2 |
| 2016 | 155,698 | 2011-2016 | 6 | 1.2 |
| 2021 | 170,367 | 2016-2021 | 9 | 1.8 |
| Source: Statistics Canada | ||||
Future Population Growth
The Regional Housing Needs Report, completed in 2020, includes population growth for the region over the next 20 years. The original projections were based on the 2016 Census Year and has since been updated given the release of 2021 Census Year data.
These projects represent the region’s current growth path allowing for some adjustments in national growth. Given annual growth rates may vary between rural and urban areas, a baseline and High Growth Scenario is provided, The Baseline Scenario is considered representative of the region.
Baseline Scenario is based on 1.1 % growth per year, showing an increase from 172,453 people in 2021 to 185,819 in 2026, and an estimated 216,008 people by 2041.
High Growth Scenario assumes a higher rate of net migration with a growth rate of 1.7 per cent annually. Under this scenario, the region’s population is estimated to increase from 172,453 people in 2021 to 190,640 in 2026, and to an estimated 239,476 people by 2041.
Note, the population projections are based on the 2021 Census Year, adjusted to account for “net Census undercoverage”. Undercoverage is the percentage of the population that is missed by the Census (balanced against those who are double counted).
Updated population projections (2021-2041) prepared by Vann Struth Consulting Group for the RDN:
Baseline Scenario
| 2021 | 2026 | 2031 | 2036 | 2041 | Growth, 2021-2041 | Average Annual Change, 2021-2041 | Average Annual Growth Rate | |
|---|---|---|---|---|---|---|---|---|
| Population | 172,453 |
185,819 |
196,752 | 206,715 | 216,008 | 43,55 | 2,178 | 1.1% |
| Age 0 to 14 | 21,367 | 22,254 | 22,286 | 22,639 | 23,220 | 1,853 | 93 | 0.4% |
| Age 15 to 24 | 15,529 | 16,432 | 18,353 | 19,035 | 19,366 | 3,837 | 192 | 1.1% |
| Age 25 to 34 | 18,541 | 18,613 | 17,807 | 18,685 | 20,780 | 2,239 | 112 | 0.6% |
| Age 35 to 44 | 19,728 | 23,056 | 24,370 | 24,486 | 23,930 | 4,212 | 221 | 1.0% |
| Age 45 to 54 | 19,536 | 20,894 | 24,410 | 27,710 | 29,249 | 9,713 | 486 | 2.0% |
| Age 55 to 64 | 27,128 | 25,452 | 24,265 | 25,619 | 29,259 | 2,130 | 107 | 0.4% |
| Age 65 to 74 | 29,142 | 31,457 | 31,595 | 30,097 | 29,286 | 144 | 7 | 0.0% |
| Age 75 to 84 | 15,720 | 21,100 | 25,300 | 27,324 | 27,324 | 11,604 | 580 | 2.8% |
| Age 85+ | 5,763 | 6,561 | 8,366 | 11,322 | 13,585 | 7,822 | 391 | 4.4% |
High Growth Scenario
| 2021 | 2026 | 2031 | 2036 | 2041 | Growth, 2021-2041 | Average Annual Change, 2021-2041 | Average Annual Growth Rate | |
|---|---|---|---|---|---|---|---|---|
| Population | 172,453 |
190,640 |
207,786 | 223,987 | 239,476 | 67,023 | 3,351 | 1.7% |
| Age 0 to 14 | 21,367 | 23,168 | 24,228 | 25,450 | 26,776 | 5,409 | 270, | 1.1% |
| Age 15 to 24 | 15,529 | 17,058 | 19,778 | 21,267 | 22,366 | 6,837 | 342 | 1.8% |
| Age 25 to 34 | 18,541 | 19,238 | 19,205 | 20,856 | 23,758 | 5,217 | 261 | 1.2% |
| Age 35 to 44 | 19,728 | 23,687 | 25,799 | 26,700 | 26,917 | 7,189 | 359 | 1.6% |
| Age 45 to 54 | 19,536 | 21,523 | 25,834 | 29,924 | 32,246 | 12,710 | 635 | 2.5% |
| Age 55 to 64 | 27,128 | 26,079 | 25,676 | 27,802 | 32,206 | 5,078 | 254 | 0.9% |
| Age 65 to 74 | 29,142 | 32,076 | 32,971 | 32,203 | 32,107 | 2,965 | 148 | 0.5% |
| Age 75 to 84 | 15,720 | 21,250 | 25,928 | 28,371 | 29,165 | 13,445 | 672 | 3.1% |
| Age 85+ | 5,763 | 6,561 | 8,366 | 11,414 | 13,935 | 8,173 | 409 | 4.5% |
Additional Information and Resources
Fax: 250-390-7511 | E-mail: askplanning@rdn.bc.ca